Advanced Monitoring Extension
About
Advanced Monitoring For EasyDCIM adds new functions to the system so that you can monitor many elements of the system automatically. The monitors are run in the background by an appropriate task queuing system. You are granted the possibility to assign monitors to specific entities or appropriate tags so that the monitor will be run for all elements with the required system tag.
Features
- Create And Manage Advanced System Monitors:
- Devices
- Network Ports
- Assign System Monitor To Multiple Devices Using Tags
- Assign System Monitor To Multiple Specific Devices
- Define Unlimited Number Of Conditions For System Monitor
- Devices:
- Hostname
- IP Address
- IPMI Status
- Inventory Status
- Load
- MAC Address
- Metadata Value
- Operating System
- Ping
- SNMP Status
- Serial Number
- Status
- Traffic: Last Hour/Day/Week/Month And Current Month
- Uptime
- Network Ports:
- Inbound Traffic
- Outbound Traffic
- Total Traffic
- Devices:
- Assign Chosen Actions To Particular Monitors:
- Send Email Notification
- Send Email To Client
- Send Slack Notification
- Send System Notification
- Execute URL
- Test System Monitors In Real Time
- Duplicate System Monitors
- View System Logs For Each Monitor
- Advanced Filtering Of System Monitors
Creating monitors
First of all, when you are creating a monitor, you need to define the type of entity for which you wish to create it. The exemplary types of entities are devices or network ports.
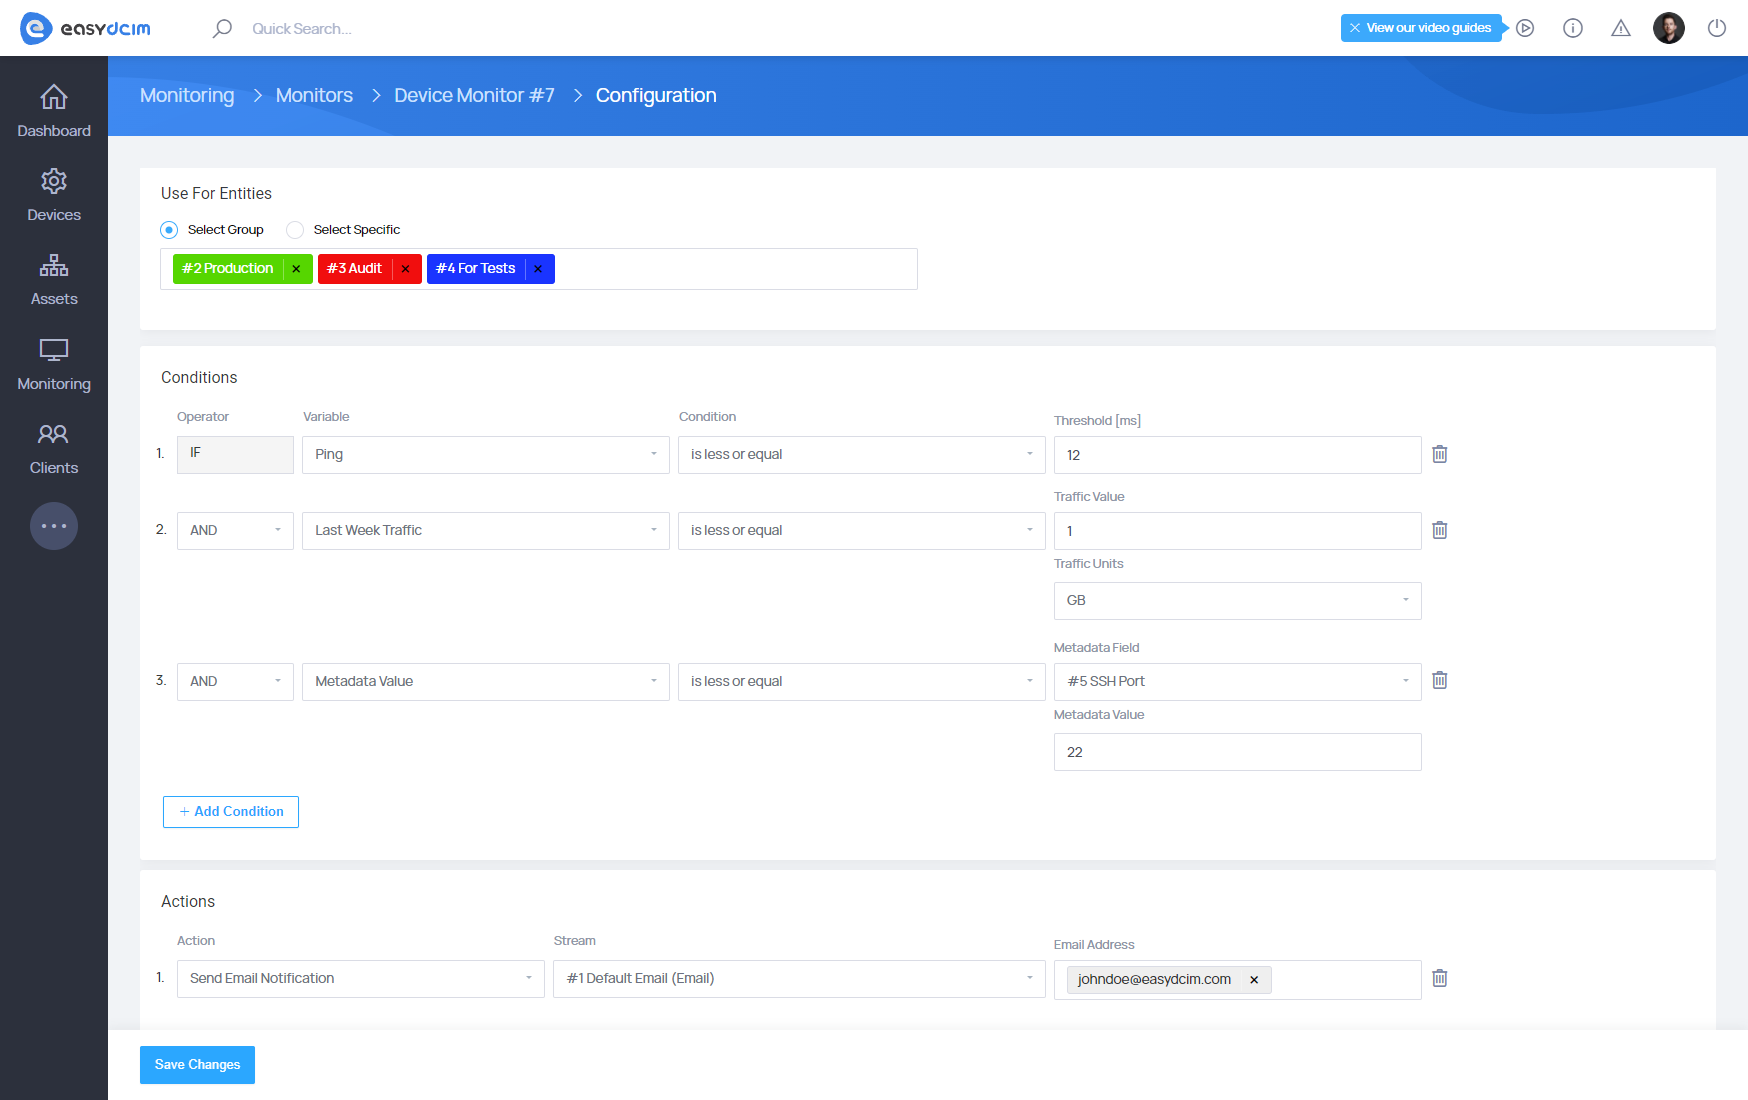
Once the monitor has been created, you will be redirected to the edit view. There you will find these fields:
- Use For Entities – you can determine whether a monitor will be assigned to a particular element of the system, e.g. a particular device. You may also assign a monitor to appropriate tags so that a monitor will be run for all devices with the desired tag.
- Conditions - you can add an unlimited number of conditions that will be verified by the system. For example, you may define that the action has to be performed only if Ping is greater than 10 ms, and the current status of the device is determined as “In Use”. In this case, the action will be carried out once these two conditions are met. Of course, you can combine the conditions with the OR operator. The OR operator returns a Boolean OR value if one or both conditions are met, otherwise it returns false.
- Actions - you can add an infinite number of actions that will be performed after fulfilling the above conditions. As an example, if a monitor checks all the conditions, an email, and Slack notifications will be sent.
- Alert Delay - allows you to delay the performance of the action before it is done. If you set the delay to 2, then a monitor will have to be run correctly three times before sending the alert.
Conditions
The conditions depend on the monitor type. For example, a monitor with the Device type will have different conditions than a monitor with the Network Port type.
Device
The monitor type used for monitoring devices such as servers, switches or PDUs.
| Condition | Description |
|---|---|
| Hostname | Verifies the value of the hostname. The value used for comparison is taken from the “Hostname” metadata for the specific device. |
| IP Address | Verifies the value of the IP address. The value used for comparison is taken from the “IP Address” metadata for the particular device. |
| IPMI Status | Verifies the IPMI status. The value used for comparison is determined by the appropriate ipmitool command during the polling process. |
| Inventory Status | Verifies the status of the device in the inventory. The value used for comparison is downloaded from the Inventory Status field for the particular device. |
| Load | Verifies the current load of the device. The value used for comparison is defined by SNMP protocol during the device polling process (UCD-SNMP-MIB::laLoad). |
| MAC Address | Verifies the MAC address value. The value used for comparison is taken from the MAC Address metadata for the specific device. |
| Metadata Value | Verifies the value of the relevant metadata. During the configuration, you can select the metadata and the desired value. The value used for comparison is downloaded from the metadata of the particular device. |
| Operating System | Verifies the value of the device operating system. The value used for comparison System is taken from the metadata for the specific device. |
| Ping | Verifies the current device ping. The value for comparison is determined by the ping command during the device polling process. |
| SNMP Status | Verifies the SNMP status. The value used for comparison is determined by the SNMP protocol during the device polling process (SNMPv2-MIB::sysObjectID). |
| Serial Number | Verifies the device’s serial number. The value used for comparison is downloaded from the Serial Number field for the particular device. |
| Status | Verifies the current status of the device. The value used for comparison is taken from the Device Status field for the specific device. |
| Uptime | Verifies the uptime of the device. The value for comparison is defined by the SNMP protocol during the device polling process (sysUpTime). |
Network port
The monitor type used for monitoring network ports.
| Condition | Description |
|---|---|
| Inbound Traffic | Verifies incoming traffic on the network port. The value used for comparison is determined by SNMP protocol during the device polling process (ifInOctets). This is the value for the last 5 minutes. |
| Outbound Traffic | Verifies outgoing traffic on the network port. The value used for comparison is defined by SNMP protocol during the device polling process (ifOutOctets). This is the value for the last 5 minutes. |
| Total Traffic | It verifies the total incoming and outgoing traffic on the network port. The value used for comparison is determined by SNMP protocol during the polling process of the device. This is the value for the last 5 minutes. |
Actions
Actions are special tasks which will be performed after fulfilling the conditions of the monitor. Actions use system notification streams to transport data.
- Send Email Notification - sends notifications using the email stream to defined email addresses
- Send Email To Client - sends notifications using the email stream to the owner of a given server
- Send Slack Notification - sends notifications using the Slack stream to the appropriate channel
- Execute URL - sends a proper request to the defined URL
- Send System Notification - sends appropriate system notifications
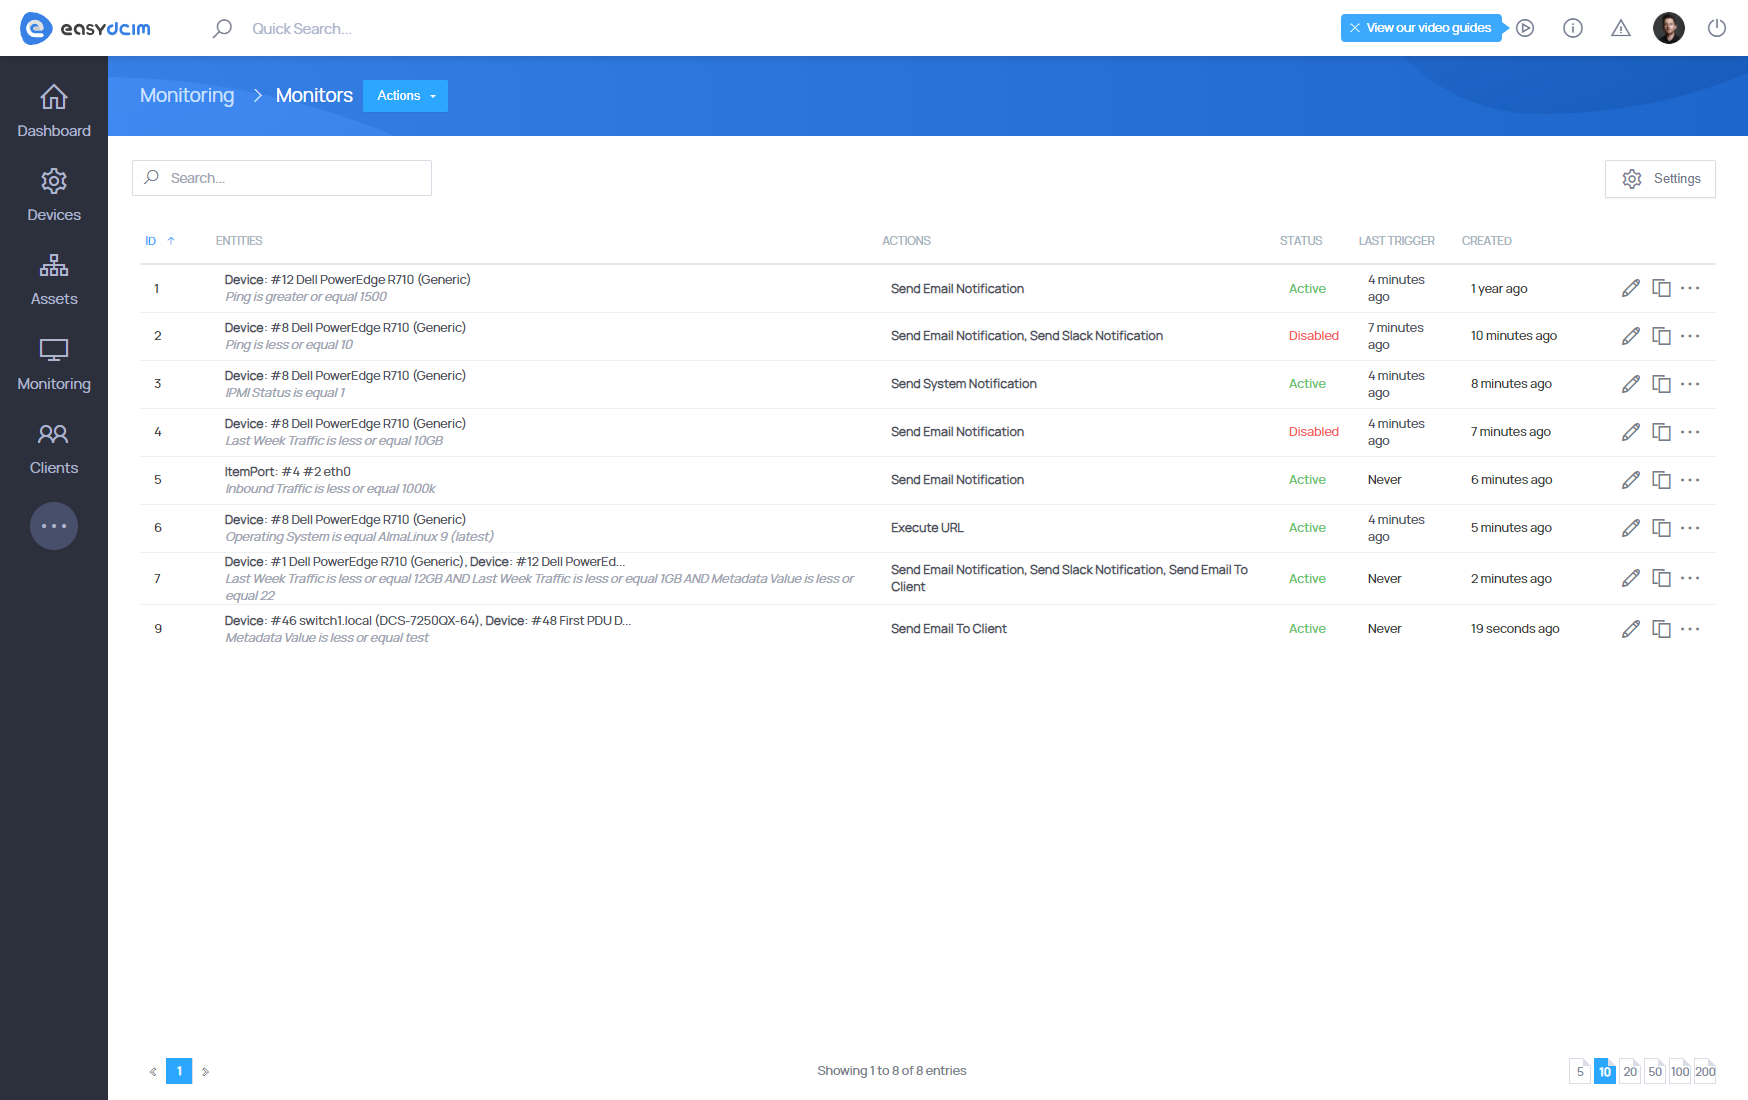
List of monitors
This section presents a list of all monitors that have been created in the system. The table contains relevant information for each monitor: assigned entities, a verbal condition that must be met, a list of actions that should be performed, and the status or last activation of the monitor.
Monitors can be freely filtered and sorted according to your needs on the basis of the following filters: monitor type, assigned entities, assigned actions or status. Monitors with the “Disabled” status are not started automatically, you can run them manually.
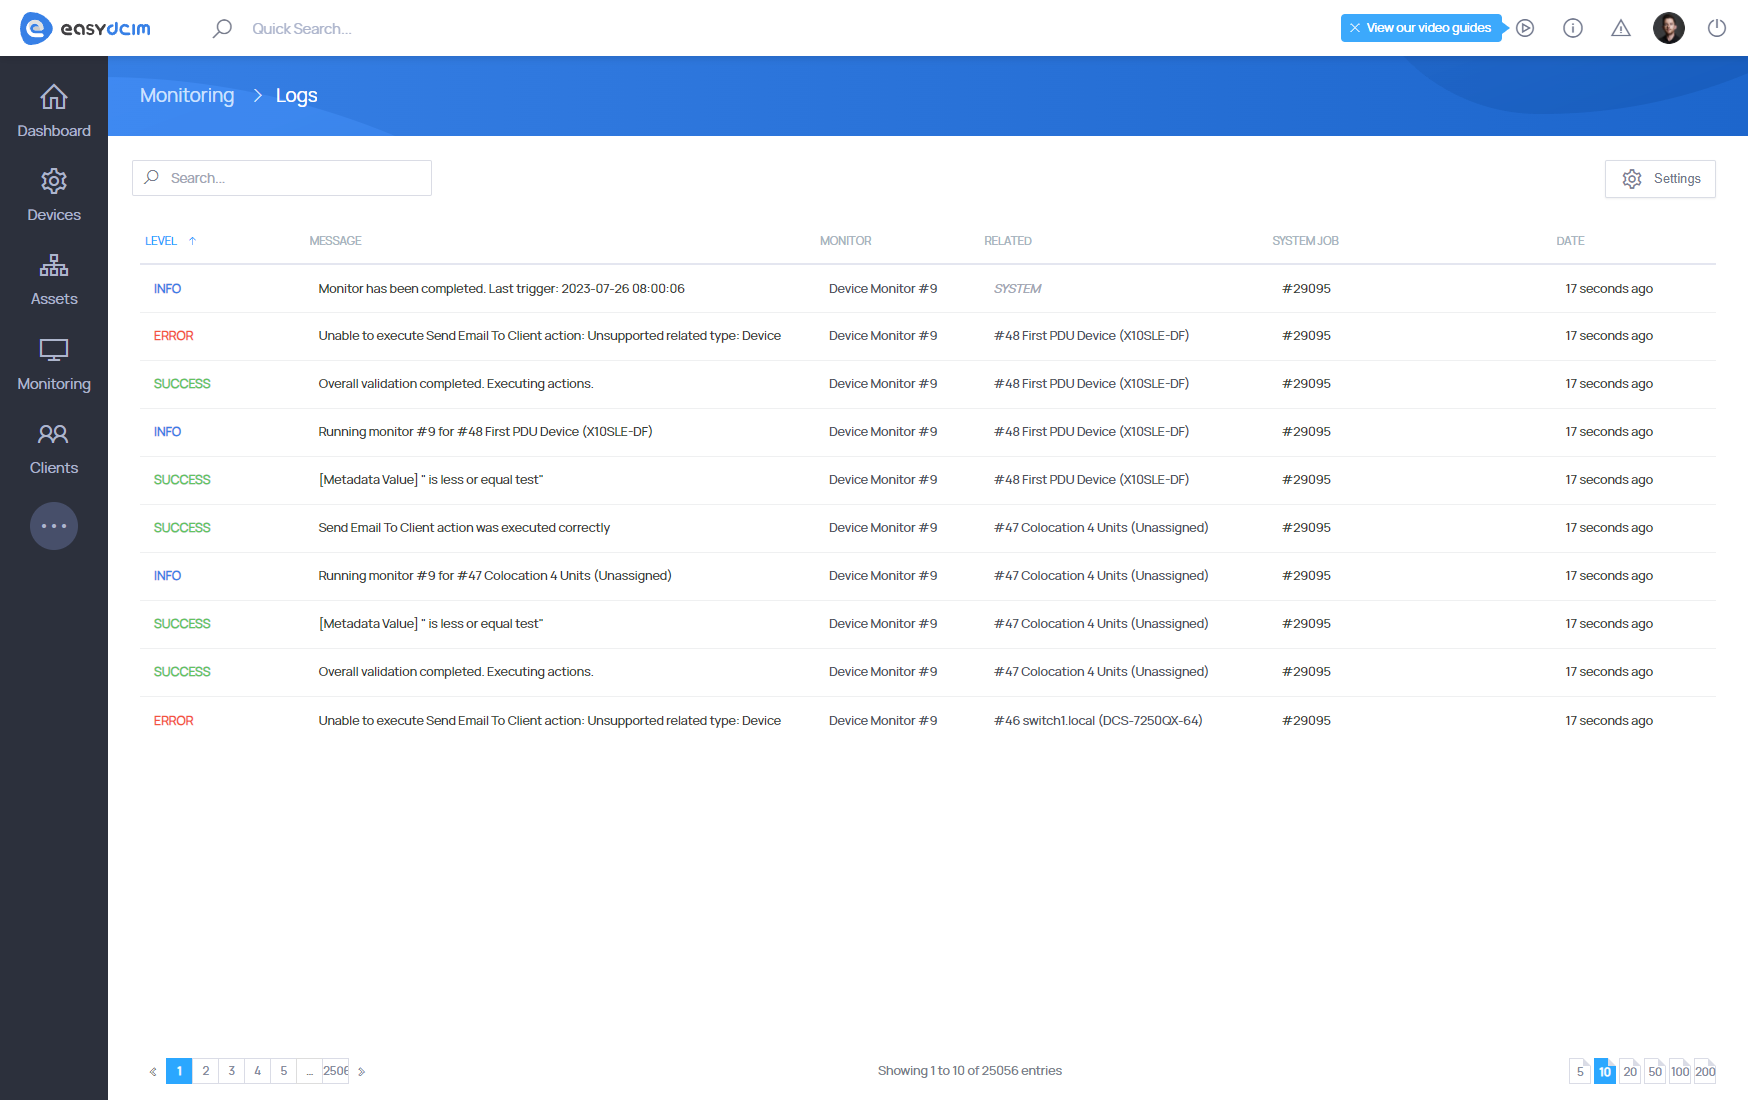
Logs
Each time you start the monitor, it generates the appropriate logs. Thanks to this information, the administrator can verify on an ongoing basis what has been done and also check the conditions that have not been met. After clicking on the entry in the “Last Trigger” column of the table, you will be redirected to the Logs section with the appropriate filtering set. Logs contain information about conditions that have been checked, and actions that have been performed. Additionally, there are data about the entity with which the monitor is associated.
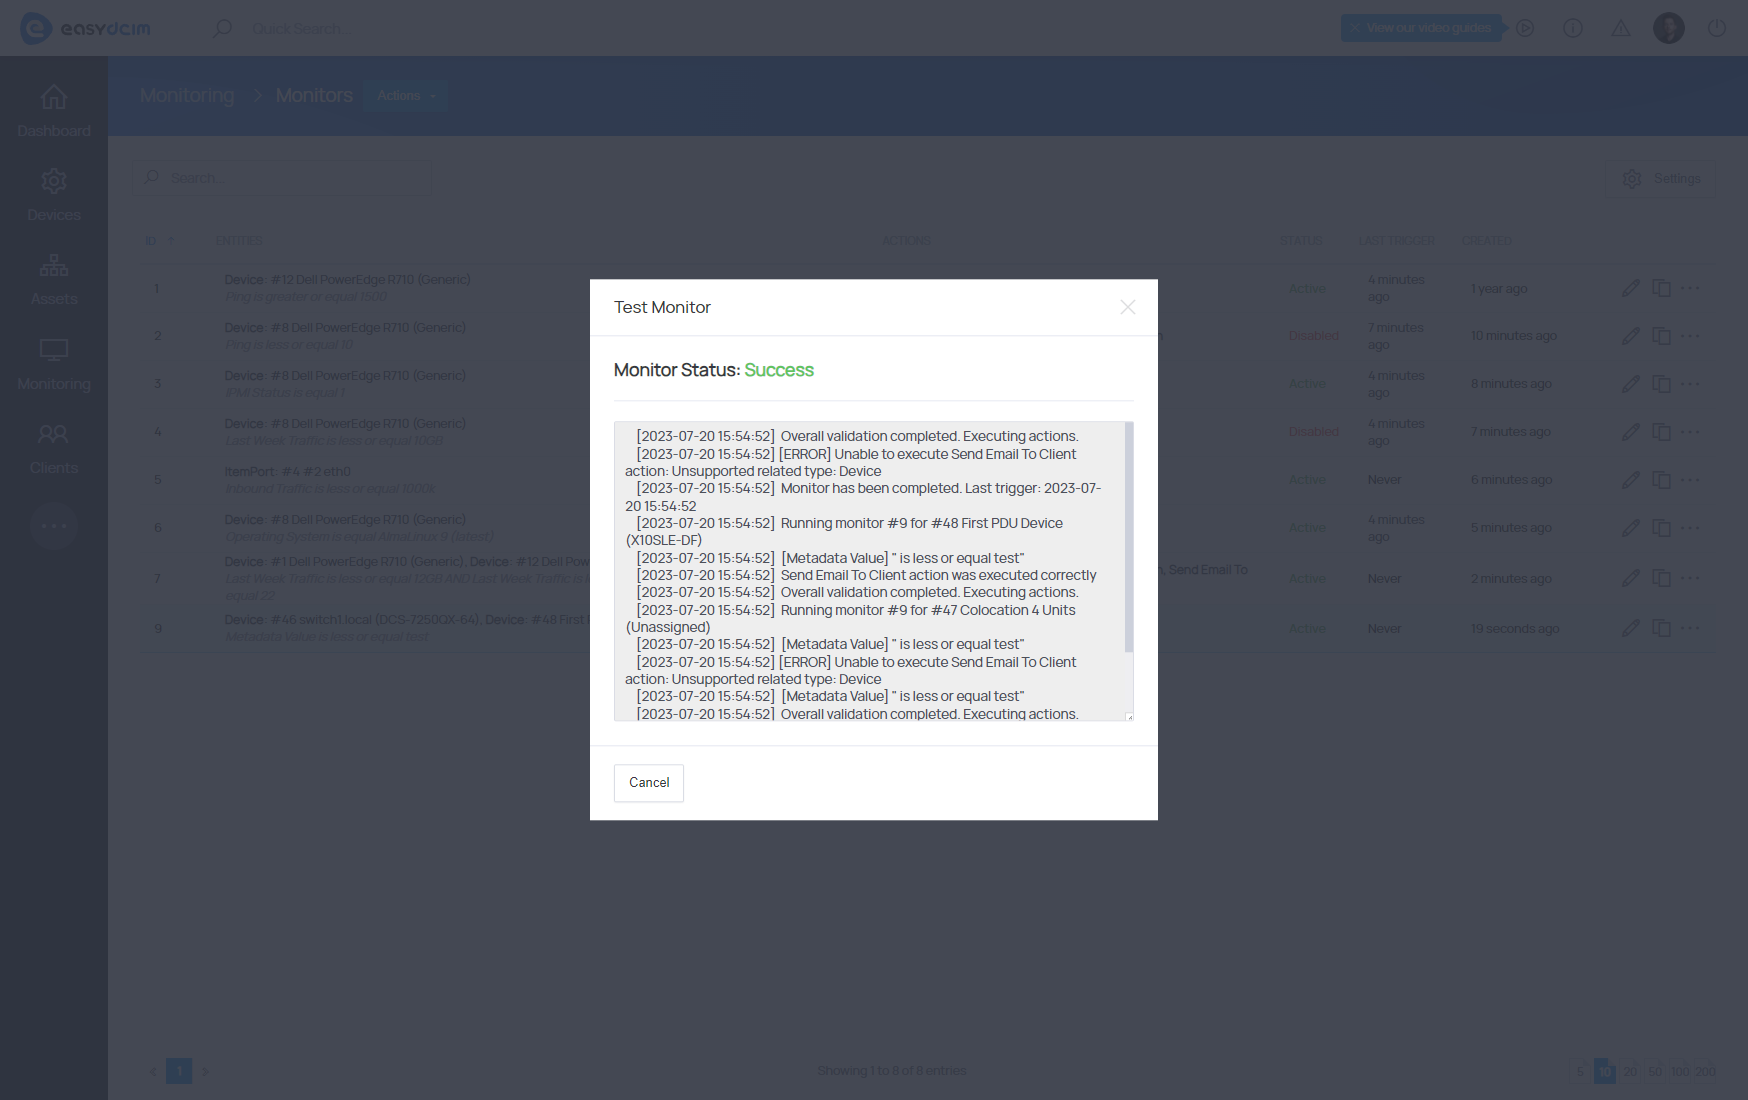
Monitor testing
As mentioned earlier, the monitors are automatically run in the background at appropriate time intervals. To verify the operation of the monitor in real time you can use the “Test” feature which will start the monitor, and display the appropriate logs on the screen. Please note that testing the monitor is the fully-fledged activation, so all actions assigned to the monitor will be carried out.
Duplication of monitor
Duplication allows you to transfer all settings to the newly created monitor. If you want the monitor to be duplicated, simply select “Duplicate. This option will automatically create a new monitor and assign it to appropriate entities, set conditions and assign system actions.
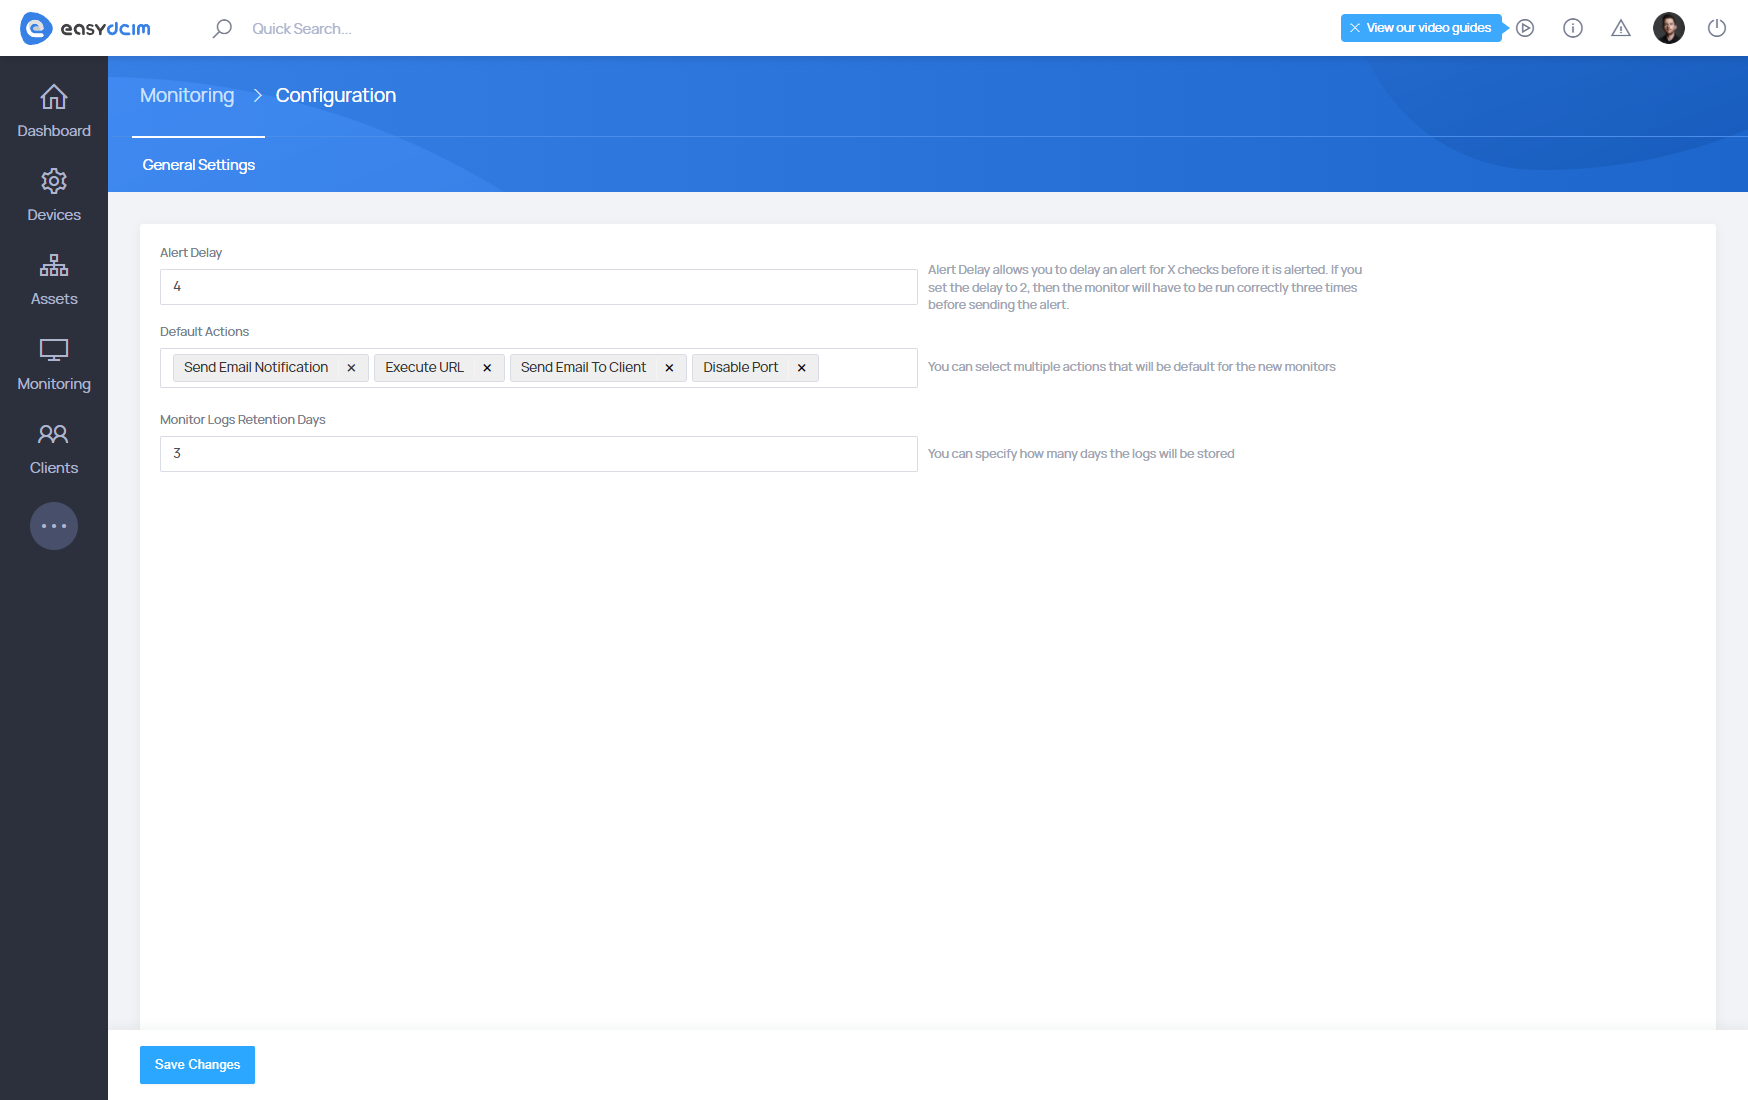
Global configuration
Global configuration allows you to set advanced monitoring functions, so you will not have to configure some fields for each monitor.
- Alert Delay - allows you to set a default value for all monitors that will be created in the system. The value given in a particular monitor overwrites the default value entered here.
- Default Actions - allows to select default actions for all monitors that will be created in the system. For example, you can send an email message to each new monitor on your system and a notification to the selected Slack channel.
- Monitor Logs Retention Days - allows you to specify the number of days during which system logs are displayed for each monitor. The default value is set to 10 days.